What data can a solar dashboard show?
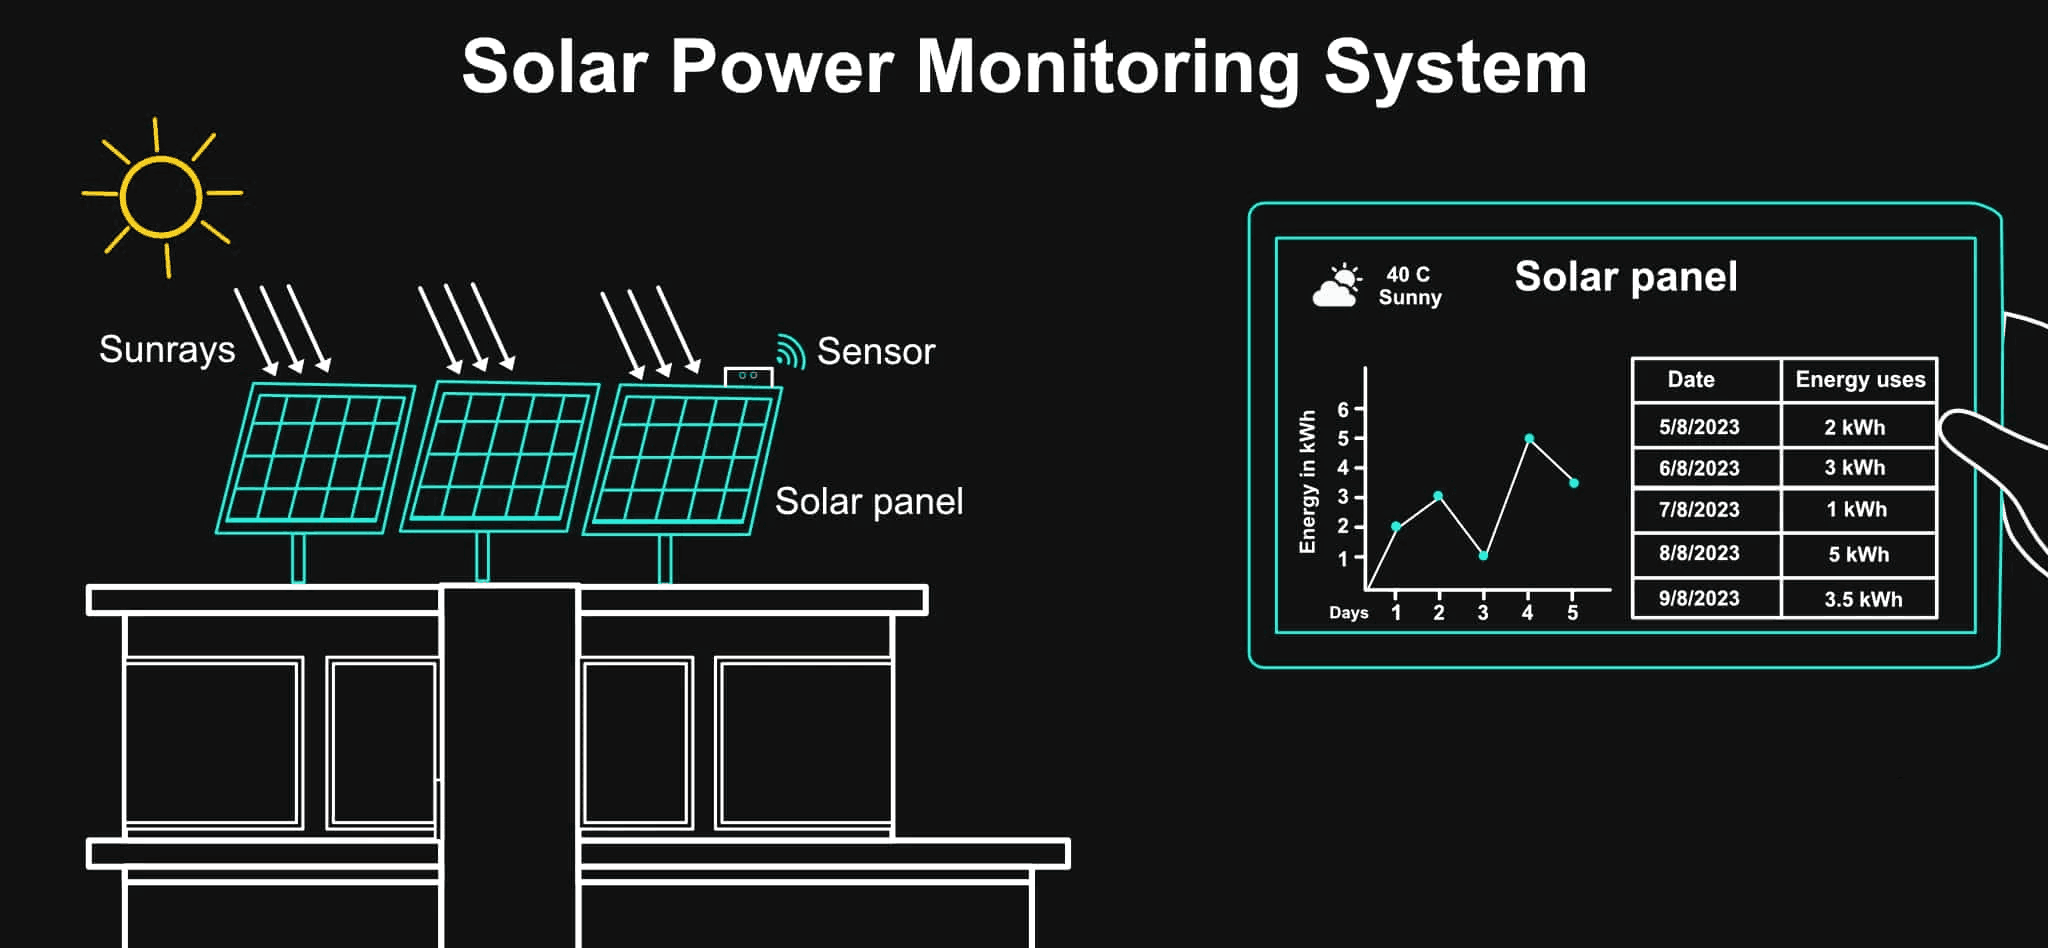
Depending on the connected inverter, meter and sensors, it can show generation, equipment status, power output and environmental readings with historical trends.
An IoT based solar monitoring system collects inverter, energy-meter and environmental readings and shows plant generation, equipment status and trends on a dashboard. Livwize connects compatible solar equipment through a gateway so operators can compare sites, investigate low output and receive configured alerts for maintenance and performance review.
01
Maximize Generation
Detect and fix underperforming strings and panels quickly.
02
Predictive Maintenance
Identify inverter and panel issues before failures.
03
ROI Tracking
Clear visibility into financial returns and payback.
Panel Performance
Individual string and panel-level power output tracking.
Inverter Diagnostics
Real-time inverter health monitoring with fault detection.
Generation Analytics
Track daily, monthly, and yearly energy generation trends.
Overview
Maximize returns on your solar investment with real-time performance monitoring. Our IoT-based Solar Monitoring system tracks panel output, inverter efficiency, energy generation vs. consumption, and weather correlation to ensure your solar plant operates at peak performance.
From rooftop installations to large-scale solar farms, our solution provides comprehensive analytics including degradation tracking, fault detection, and ROI calculations.
Key Benefits
Use the solar plant performance measurements below to review conditions, investigate changes and coordinate the team responsible for the equipment.
Detect and fix underperforming strings and panels quickly.
Identify inverter and panel issues before failures.
Clear visibility into financial returns and payback.
Track PR against benchmarks for quality assurance.
Understand weather impact on generation performance.
Monitor your solar plant from anywhere in the world.
How It Works
Deploy irradiance, temperature, and power sensors at the solar plant.
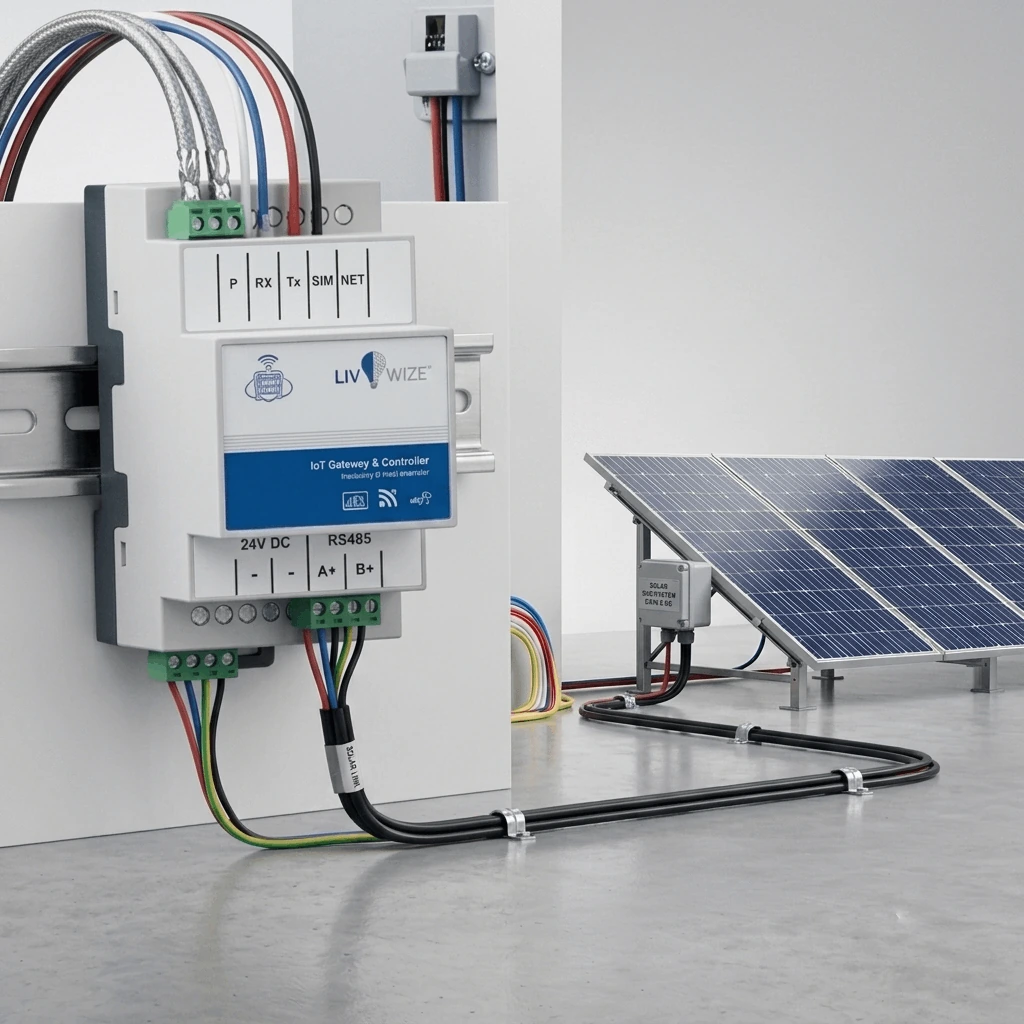
Wizelog data logger captures inverter and sensor data.
The platform records generation and supported inverter faults for review.
Real-time and historical analytics on web and mobile app.
Applications
Match the solar plant performance configuration to the instruments, network and operator workflow at each installation.
Large-scale utility solar plant monitoring.
Office and commercial building rooftop solar tracking.
Home solar system performance monitoring.
Factory rooftop and ground-mounted solar monitoring.
Solar monitoring for schools, hospitals, and government.
Performance tracking and O&M management for EPCs.
A solar monitoring system begins with the information available from the installation. Inverter registers, compatible meters and environmental sensors provide different views of performance. The gateway collects those readings and forwards them to the data platform, where the operator can compare present conditions with the plant’s recent generation history.
Livwize supports rooftop installations and larger solar plants. It brings panel and string performance, inverter diagnostics and generation analytics into a connected workflow. Define the exact monitoring points for the selected inverter and plant layout, since a plant-level energy reading does not automatically provide a separate measurement for every panel.
Each device should have a clear identity and timestamp in the dashboard. This helps distinguish a communications interruption from a generation change and keeps a replacement device associated with the correct equipment. For an operator responsible for several plants, consistent naming and a common record format make comparisons more useful.
Solar generation changes with operating and environmental conditions. Irradiance and temperature measurements add context to inverter and energy records, making it easier to investigate a change without relying only on a daily total. Compare the same time periods and units when reviewing several inverters or sites.
A dashboard can show daily, monthly and yearly generation trends and bring inverter fault information into the same view. Review the timing of the event alongside the latest available measurements before deciding whether a site visit is needed. When a reading is unavailable, the platform should make that status clear rather than present it as a confirmed zero.
Performance-ratio and financial-return analysis add context to generation records. Those views depend on the input measurements and assumptions supplied for the installation. Agree the comparison periods, plant reference data and any tariff assumptions before using the result for a business decision. A monitoring configuration should keep those assumptions understandable to the team that operates it.
WizeLog collects compatible inverter and sensor data for the solar monitoring workflow. Match its interfaces to the inverter and sensors at the site. Confirm register access, measurement scaling and logging intervals during integration. The table lists the solar monitoring areas; each deployment needs its own confirmed instrument and parameter list.
| Measurement | Operational purpose | Integration check |
|---|---|---|
| Generation | Daily, monthly and yearly output trends | Confirm meter or inverter energy register |
| Inverter status | Fault and operating-state review | Map available diagnostic codes |
| Power output | Compare plant and inverter operation | Confirm units and scaling |
| Irradiance | Interpret changing solar input | Select compatible field sensor |
| Temperature | Add environmental and equipment context | Confirm sensor location and range |
| String / panel data | Investigate underperformance where measured | Confirm monitoring hardware coverage |
| Logging interval | Align records across devices | Configure gateway and data platform |
Depending on the connected inverter, meter and sensors, it can show generation, equipment status, power output and environmental readings with historical trends.
Compatibility depends on the inverter interface, supported protocol and register access. Confirm the exact model and available measurements before selecting the gateway.
Next Step
Get real-time visibility into your solar investment with IoT monitoring.