Environmental Monitoring

IoT Based Air Quality Monitoring System

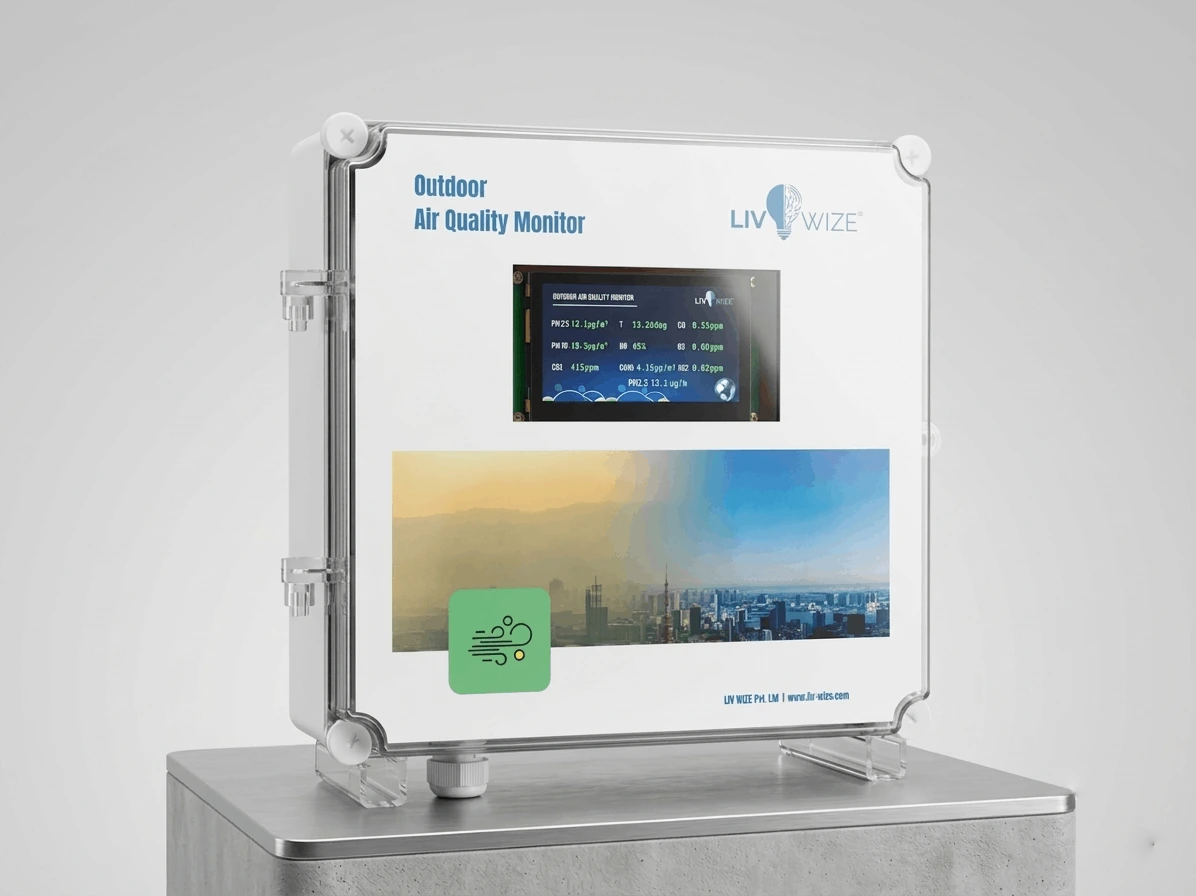
An IoT based air quality monitoring system uses connected sensors to measure particulate matter (PM2.5, PM10), gases, temperature and humidity continuously and sends the readings to a cloud dashboard. Livwize supplies the sensors, data logger and platform, with alerts when limits are crossed and reports for audits and pollution-control compliance.

AQI Monitoring System

Real-time air quality monitoring for industries, smart cities, and environmental compliance. Track PM2.5, PM10, CO2, CO, NO2, SO2, O3, temperature, humidity, and live device data from one connected dashboard.

  • 01

    Better Pollution Visibility

    See live particulate and gas data across devices, stations, and sites without waiting for manual field checks.

  • 02

    Faster Alert Response

    Threshold-based notifications help operations teams act quickly when air quality conditions degrade.

  • 03

    Compliance Monitoring

    Keep cleaner records for environmental oversight, audits, and reporting requirements across monitored locations.

Air Quality Monitoring System
How an IoT air quality monitoring system works
  • Real-Time AQI Monitoring

    View live air quality values from connected stations and devices across industrial, urban, and environmental sites.

  • PM2.5 & PM10 Tracking

    Track particulate concentration continuously to understand exposure risk, dust levels, and changing ambient conditions.

  • Gas Sensor Integration

    Connect CO2, CO, NO2, SO2, O3, VOC, temperature, and humidity sensors into one monitoring workflow.

Overview

How an IoT air quality monitoring system works

The Air Quality Monitoring System collects live environmental data from particulate and gas sensors, edge devices, and connected field installations. It captures PM2.5, PM10, CO2, CO, NO2, SO2, O3, temperature, and humidity so teams can understand changing pollution conditions in real time.

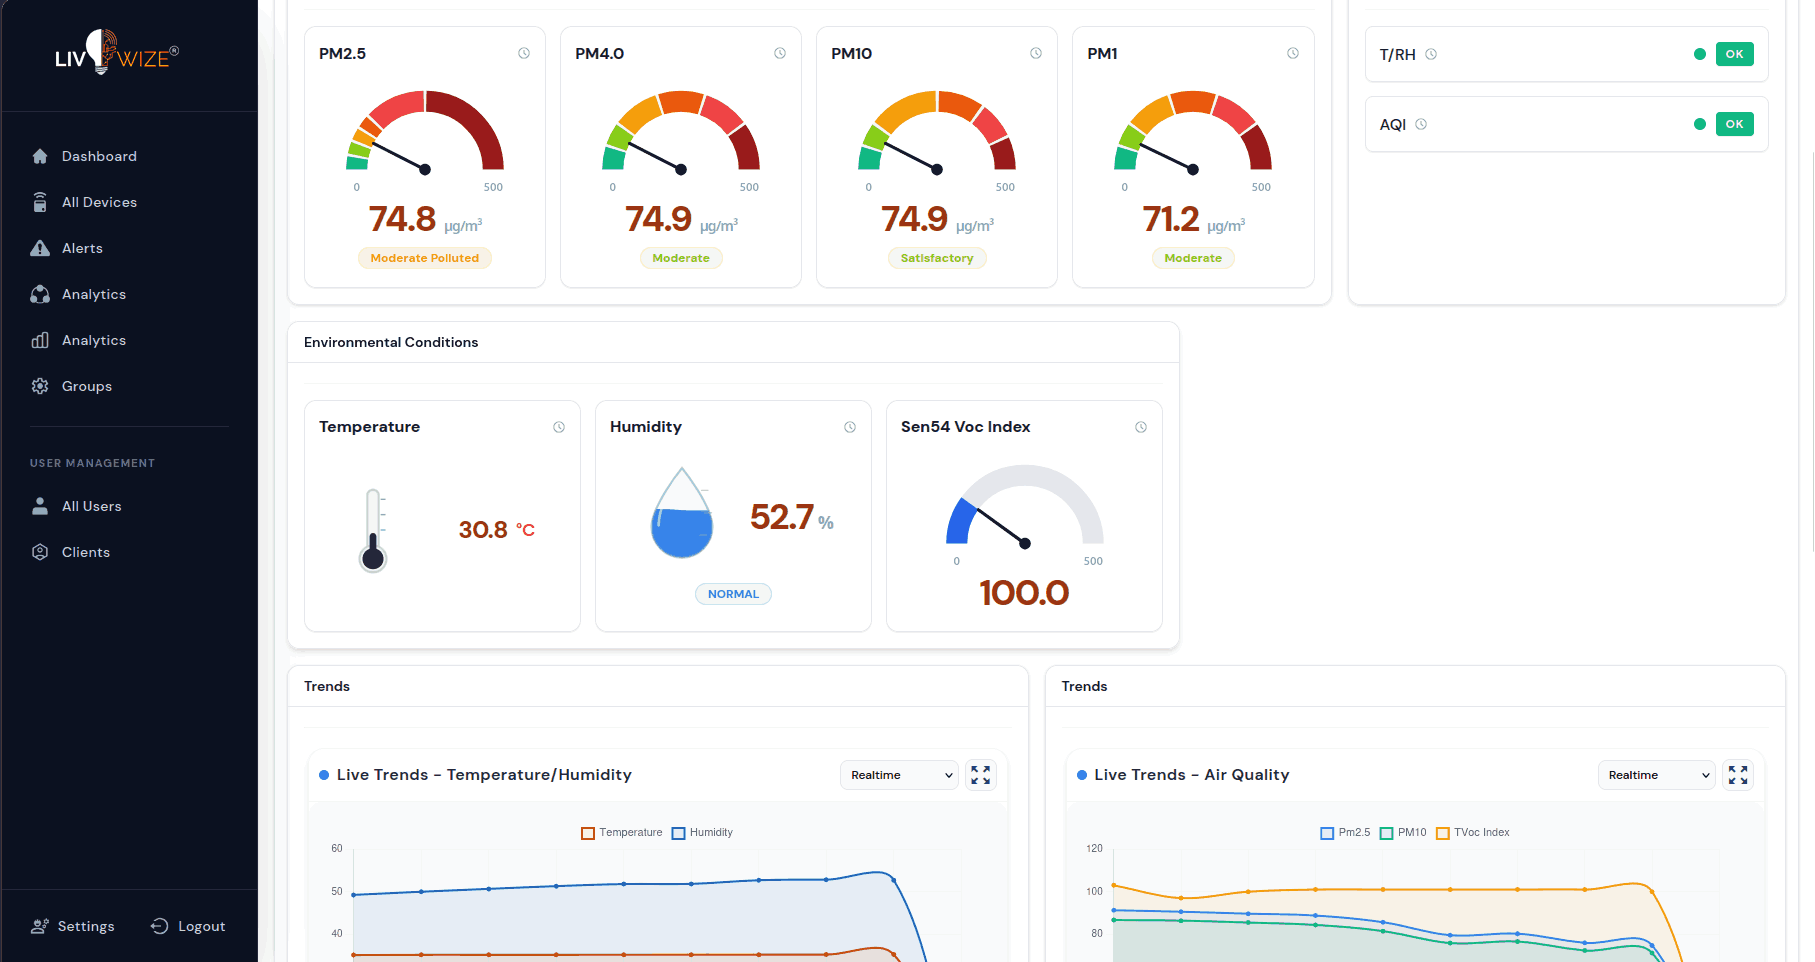
Sensor and device data is sent through an IoT gateway to a cloud dashboard where operators can monitor current values, compare historical trends, review threshold breaches, and respond faster with alerts, reports, and compliance-ready records.

Key Benefits

Air-quality trends and alerts for site teams

Use the air-quality monitoring measurements below to review conditions, investigate changes and coordinate the team responsible for the equipment.

  • Better Pollution Visibility

    See live particulate and gas data across devices, stations, and sites without waiting for manual field checks.

  • Faster Alert Response

    Threshold-based notifications help operations teams act quickly when air quality conditions degrade.

  • Compliance Monitoring

    Keep cleaner records for environmental oversight, audits, and reporting requirements across monitored locations.

  • Reduced Manual Data Collection

    Automate measurement, transmission, and dashboard updates to reduce repetitive logging and field effort.

  • Multi-Location Monitoring

    Track multiple stations, plants, campuses, or urban points from one connected platform.

How It Works

Air-quality measurement, cloud transmission and alerts

  • 01

    Sensors collect air quality data

    Field sensors continuously capture particulate, gas, temperature, and humidity readings from the monitored environment.

  • 02

    IoT gateway sends data to cloud

    An IoT gateway or edge device securely transmits sensor data to the central platform for processing and visibility.

  • 03

    Dashboard shows live values and trends

    Operators review current readings, compare trends, and monitor location-level performance from one interface.

  • 04

    Alerts trigger on threshold breach

    Notification workflows activate automatically when pollutant or environmental limits move outside acceptable ranges.

  • 05

    Reports support analysis and compliance

    Teams use stored data, trends, and summaries to improve decisions and support environmental reporting.

Applications

Air monitoring for industrial and indoor environments

Match the air-quality monitoring configuration to the instruments, network and operator workflow at each installation.

  • Industries

    Monitor plant emissions, indoor process air, and workplace exposure conditions across industrial operations.

  • Smart cities

    Create connected urban air-quality visibility with distributed sensors across roads, districts, and public spaces.

  • Construction sites

    Track dust, particulate spikes, and changing site conditions to support safer and more compliant work zones.

  • Schools and campuses

    Observe outdoor and indoor air quality across learning environments, hostels, and shared facilities.

  • Hospitals

    Monitor sensitive environments where cleaner air and quick visibility into changing conditions matter.

  • Environmental monitoring stations

    Support long-term monitoring programs with connected data, trends, and centralized reporting.

Air quality sensors for B2B and industrial sites

A B2B IoT sensor for air quality should be selected for the pollutant, concentration range and environment it will measure. A workplace, an outdoor station and an industrial process area need different placement and enclosure decisions. Review calibration and maintenance requirements along with network connectivity.

Livwize integrates particulate, gas, temperature and humidity readings into one monitoring workflow. The available channels depend on the fitted sensors. A connected dashboard can compare locations and alert on configured thresholds; the deployment specification should identify the instrument and its measurement range for each channel.

Published air-quality integration parameters and sensor measurement ranges
Parameter Measurement Measurement Range Sensor type
PM2.5 Fine particulate concentration 0–1000 µg/m³ Confirm the fitted PM2.5 sensor model and measurement method
PM10 Particulate concentration 0–1000 µg/m³ Confirm the fitted PM10 sensor model and measurement method
CO₂ Carbon dioxide 400–2000 ppm Confirm the fitted CO₂ sensor model and measurement method
CO Carbon monoxide 0–500 ppm Confirm the fitted CO sensor model and measurement method
NO₂ Nitrogen dioxide 0–20 ppm Confirm the fitted NO₂ sensor model and measurement method
SO₂ Sulphur dioxide 0–20 ppm Confirm the fitted SO₂ sensor model and measurement method
O₃ Ozone 0–10 ppm Confirm the fitted O₃ sensor model and measurement method
VOC Volatile organic compounds 0–500 ppb / index Confirm the fitted VOC sensor model and measurement method
Temperature Air temperature −20°C to +70°C Confirm the fitted Temperature sensor model and measurement method
Humidity Relative humidity 0–100% RH (±2% RH) Confirm the fitted Humidity sensor model and measurement method

IoT air pollution monitoring for industrial sites

For fence-line monitoring, choose locations that represent the site boundary and document nearby sources, weather exposure and sampling height. Around a stack, ambient measurements describe the surrounding air; they do not replace the plant’s in-stack analyser or its configured pollution-control compliance system.

Construction-dust monitoring needs a particulate sampling arrangement suited to outdoor exposure and site activity. Compare time-stamped trends with work schedules and weather before interpreting a spike. Specify the required PM fractions, range, calibration and cleaning plan for the selected monitor.

A connected dashboard can compare monitoring points and alert on agreed thresholds. Confirm which readings are indicative operational measurements and which instruments are approved for a required reporting purpose. The fitted sensor specification and the applicable site reporting requirements determine that distinction.
Frequently asked questions

What does an IoT air quality monitoring system measure?

Depending on the fitted sensors, it records particulate matter, gases, temperature and humidity. Select the required channels and measurement ranges for the site; a general list of pollutants is not a guarantee that every device measures every channel.

What is ambient air quality monitoring?

Ambient monitoring measures the surrounding outdoor air rather than an individual stack or effluent stream. Sensor placement, weather exposure and the pollutants of interest determine the installation and interpretation of readings.

Can the data be sent to the pollution control board?

Livwize supplies CPCB and SPCB data-transmission devices for compatible monitoring systems. A technical review must confirm the analyser outputs, portal requirements and commissioning configuration for the specific regulated site.

Next Step

Start Monitoring Air Quality in Real Time

Request a demo to see how connected sensors, live dashboards, and smart alerts can improve air quality visibility across your sites.