What is a sensor in IoT?
A sensor in IoT is the component that turns a physical condition — temperature, humidity, pressure, level, gas or energy — into a reading that a connected device can send to software for monitoring, alerts and control.
IoT sensors are devices that measure a physical quantity — such as temperature, humidity, pressure, level, flow, gas concentration, vibration or energy — and send the reading over a network to software for monitoring and control. In industry they connect through a gateway or data logger using 4–20 mA, RS-485 Modbus, LoRa, Wi-Fi or 4G.
By Livwize engineering team · Updated
Smart sensor solutions for agriculture, industry, healthcare, and environmental monitoring. Real-time data collection, cloud-ready, and scalable for any deployment.
01
Real-time Data
Instant monitoring and alerts for any deviation from set thresholds.
02
Predictive Maintenance
Detect anomalies before failures occur, reducing downtime.
03
Cost Reduction
Lower operational costs through automation and optimized resource usage.
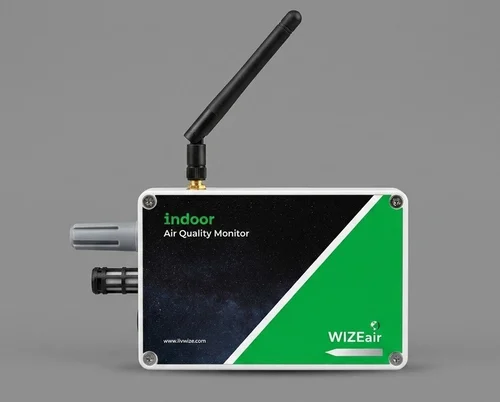
Internet of Things sensors turn physical conditions into records that software can use. The table is a selection guide, not a list of interchangeable products. A bare digital sensing chip usually needs a transmitter or controller before it can connect to an industrial network.
Named component ranges are educational examples from Texas Instruments and Sensirion, not specifications for Livwize devices. Pressure, flow, level and vibration ranges depend strongly on the process, so select them from the actual instrument datasheet. Check accuracy across the working range, not just the largest number on the label.
| Sensor type | What it measures | Typical output | Range or selection example | Typical use |
|---|---|---|---|---|
| Temperature | Temperature in °C | Analogue, RS-485 or digital/wireless transmitter | Example: TMP117 −55 to +150°C | Cold rooms and process equipment |
| Humidity | Relative humidity | Digital, RS-485 or wireless | Example: HDC3020 0–100% RH | Storage and HVAC |
| Pressure | Fluid or gas pressure | 4–20 mA or RS-485 | Choose bar/kPa span for the process | Pumps and pipelines |
| Level | Liquid level or distance | 4–20 mA, RS-485 or switch | Choose span for tank height and dead zone | Tanks and reservoirs |
| Flow | Flow rate and total volume | Pulse, 4–20 mA or Modbus | Choose L/min or m³/h for pipe and fluid | Water and effluent |
| CO₂ | Carbon dioxide concentration | Digital or networked transmitter | Example: SCD30 400–10,000 ppm | Ventilation and greenhouses |
| Particulate matter | PM concentration | Digital or RS-485 transmitter | Example: SPS30 0–1000 µg/m³ | Air quality and dust trends |
| Vibration | Acceleration or velocity | Analogue, digital or wireless | Select amplitude and frequency band | Rotating machinery |
| Energy / current | Electrical load and consumption | Modbus meter or transducer | Match meter and current-transformer rating | Feeders and machines |
| Soil moisture | Water content in soil | Analogue, digital or wireless | Use the probe’s soil-calibrated span | Agriculture and irrigation |
| Light | Illuminance | Digital or networked transmitter | Example: OPT3001 0.01 to 83k lux | Buildings and growing areas |
| Proximity / door | Presence or open/closed state | Digital switch or wireless contact | Binary state or rated sensing distance | Doors and machine positions |
| Water quality | pH, conductivity or another selected parameter | 4–20 mA or RS-485 transmitter | Parameter and chemistry-specific range | Treatment and process water |
Temperature sensors show whether equipment, stored goods or a process is heating or cooling. A room sensor measures air, while a correctly selected probe can measure a pipe or liquid. Choose the sensing element, mounting and response time for the installation; an air sensor does not automatically become an immersion probe.
Humidity sensors measure relative humidity alongside temperature to describe the moisture conditions in air. They help teams investigate storage excursions, condensation risks or greenhouse climate changes. Place the sensor away from direct spray and local heat sources, and check its recovery and calibration requirements for the expected environment.
Pressure transmitters monitor a fluid or gas and provide a signal for a gateway or controller. Pump discharge and filter differential pressure answer different questions and need different connection arrangements. Specify the working span, overload conditions, wetted materials and whether the measurement is gauge, absolute or differential pressure.
Level instruments indicate the contents of a tank, sump or reservoir. Ultrasonic, radar, pressure and float approaches suit different fluids and mounting points. Tank shape and sensor position affect the conversion from distance to volume, so confirm the geometry and validate low-level and overflow alerts during commissioning.
Flow meters provide the rate of movement and, when supported, a cumulative total. They help compare incoming supply, process use and discharge. The meter must suit the fluid, pipe size and installation arrangement; a pulse output also needs the correct pulse factor before the dashboard can show reliable totals.
A CO₂ sensor reports carbon dioxide concentration rather than every pollutant in the air. Readings can support ventilation review or controlled-growing applications when interpreted with occupancy and operating conditions. Confirm the sensor technology and calibration method; an estimated CO₂ value inferred from another signal is a different measurement.
Particulate sensors estimate airborne particle concentrations, often by optical scattering. PM2.5 and PM10 identify particle size fractions, while the dashboard reports the corresponding concentration and unit. Select the sampling arrangement for the location and review maintenance needs; an indoor sensor enclosure does not establish outdoor or regulatory suitability.
Vibration sensors capture mechanical movement on motors, fans, pumps and other rotating assets. A useful record depends on the mounting, sample rate and frequency band as well as the amplitude. Trending can highlight changes for investigation, but a single elevated reading does not identify a specific mechanical fault by itself.
Energy monitoring combines meter measurements with circuit identity, units and current-transformer settings. Current alone does not provide a complete electricity consumption record. A connected energy meter can supply kWh, power factor, voltage and other supported registers so operators can compare feeders and relate consumption to the operating schedule.
Soil-moisture probes indicate conditions at their installed depth and location. A field with different soil types or irrigation zones may need several measurement points. Check the probe’s calibration basis and compare trends with the grower’s observations before using the data to change pump or valve settings.
Light sensors measure illuminance or another specified optical quantity for buildings and growing environments. A lux reading describes light weighted for human vision; it does not replace every plant-light measurement. Choose the optical response, mounting direction and range for the decision the operator needs to make.
Proximity switches and door contacts provide a state such as present/absent or open/closed. These simple readings can explain access events or equipment position alongside other measurements. Decide how quickly a state change must be captured and distinguish an open contact from a disconnected cable in the installation design.
Water-quality instruments measure a named parameter such as pH or conductivity. A multi-parameter dashboard still needs a suitable probe and calibration procedure for each channel. Sample conditions, fouling and chemical compatibility affect results, so include cleaning, reference checks and replacement access in the maintenance plan.
A sensor first converts the physical condition into an electrical or digital signal. A transmitter or gateway reads that signal, applies the configured scaling, adds a timestamp and sends the record over an available network. Cloud software stores the value and associates it with the device and measurement point.
For a 4–20 mA transmitter, the current represents the configured measurement span. Modbus devices expose registers that need the right addresses, byte order and scaling. Wireless sensors add radio and power choices. These are different integration routes; the gateway must support the selected output and the required protocol.

| Industry | Sensor examples | Operator use |
|---|---|---|
| Manufacturing | Temperature, pressure, vibration, energy | Review machine conditions and investigate changes |
| Agriculture | Soil moisture, air temperature, humidity, light | Compare zones and plan irrigation |
| Energy | Current, voltage, energy meters, temperature | Compare load, generation and equipment conditions |
| Buildings | Temperature, humidity, CO₂, door contacts | Review cooling, ventilation and access events |
| Water | Level, flow, pressure and water-quality probes | Track storage, supply and selected quality parameters |
Begin with the decision: what should someone do when the reading changes? Define the normal and abnormal conditions, required accuracy and response time. Then check environmental exposure, power, network coverage and available mounting points. A sensor with the right range can still fail to answer the question if it is placed in the wrong location.
Agree units, device identifiers and a common timestamp convention before connecting the dashboard. Include disconnected probes, stale data, a gateway restart and loss of connectivity in commissioning. These checks help separate a process event from a measurement or communication problem, and give operators a record they can interpret.
Plan calibration, cleaning and battery changes alongside the installation. Record the model, measurement range, mounting position and settings for each sensor so a replacement can produce a consistent record. Check an instrument against a suitable reference during commissioning and document how the team recognises a missing or stale value.
Livwize integrates industrial temperature, humidity, energy, water and environmental measurements with gateways and dashboards. Review temperature sensor products and humidity sensors for environmental monitoring, or compare tank-level monitoring and air-quality monitoring for the application. A deployment brief should identify the fitted model, measurement range, interface and enclosure.
The component examples above use manufacturer specifications. They illustrate the variety of sensor ranges and do not identify the components fitted in a Livwize product.
A sensor in IoT is the component that turns a physical condition — temperature, humidity, pressure, level, gas or energy — into a reading that a connected device can send to software for monitoring, alerts and control.
Sensors are wired (4–20 mA, RS-485 Modbus) or wireless (LoRa, BLE, Wi-Fi) to a gateway or data logger, which sends the readings over 4G, Ethernet or Wi-Fi to a cloud platform using protocols such as MQTT or HTTPS.
The most common are temperature, humidity, pressure, level, flow, gas and air-quality, vibration and energy sensors, used for process monitoring, predictive maintenance, environmental compliance and energy management.
A sensor measures a physical condition and produces a reading. An actuator changes something in the physical system, for example switching a relay, opening a valve or driving a fan in response to a control command.
Start with the quantity, measurement range, accuracy and environment. Then match the output, power supply, installation method and reporting interval to the gateway and monitoring task.
How It Works
Physical sensors capture real-time environmental data, temperature, humidity, pressure, and more.
Microcontroller processes raw data locally and prepares for wireless transmission.
Data transmitted via Wi-Fi, 4G, LoRa, or NB-IoT to cloud dashboards and analysis.
Visualize insights on dashboards, trigger alerts, and automate control responses.
Applications
Match the sensor networks configuration to the instruments, network and operator workflow at each installation.
Monitor machinery performance, energy consumption, and environmental conditions.
Soil, weather, and crop monitoring.
Monitor pharma storage conditions and patient vitals remotely.
Traffic, air quality, and public utility monitoring.
Power consumption, solar PV, and grid monitoring.
Custom sensor kits for research and development projects.
Next Step
Our team designs custom sensor kits tailored to your application. Plug-and-play hardware with long battery life.